Benchmark Data for Cross-Study Analysis
The benchmark data for Cross-Study Analysis (CSA) include four kinds of data, which are cell line response data, cell line multi-omics data, drug feature data, and data partitions. The figure below illustrates the curation, processing, and assembly of benchmark data, and a unified schema for data curation. Cell line response data were extracted from five sources, including the Cancer Cell Line Encyclopedia (CCLE), the Cancer Therapeutics Response Portal version 2 (CTRPv2), the Genomics of Drug Sensitivity in Cancer version 1 (GDSC1), the Genomics of Drug Sensitivity in Cancer version 2 (GDSC2), and the Genentech Cell Line Screening Initiative (GCSI). These are five large-scale cell line drug screening studies. We extracted their multi-dose viability data and used a unified dose response fitting pipeline to calculate multiple dose-independent response metrics as shown in the figure below, such as the area under the dose response curve (AUC) and the half-maximal inhibitory concentration (IC50). The multi-omics data of cell lines were extracted from the the Dependency Map (DepMap) portal of CCLE, including gene expressions, DNA mutations, DNA methylation, gene copy numbers, protein expressions measured by reverse phase protein array (RPPA), and miRNA expressions. Data preprocessing was performed, such as descritizing gene copy numbers and mapping between different gene identifier systems. Drug information was retrived from PubChem. Based on the drug SMILES (Simplified Molecular Input Line Entry Specification) strings, we calculated their molecular fingerprints and descriptors using the Mordred and RDKit Python packages. Data partition files were generated using the IMPROVE benchmark data preparation pipeline. They indicate, for each modeling analysis run, which samples should be included in the training, validation, and testing sets, for building and evaluating the drug response prediction (DRP) models. The Table below shows the numbers of cell lines, drugs, and experiments in each dataset. Across the five datasets, there are 785 unique cell lines and 749 unique drugs. All cell lines have gene expression, mutation, DNA methylation, and copy number data available. 760 of the cell lines have RPPA protein expressions, and 781 of them have miRNA expressions.
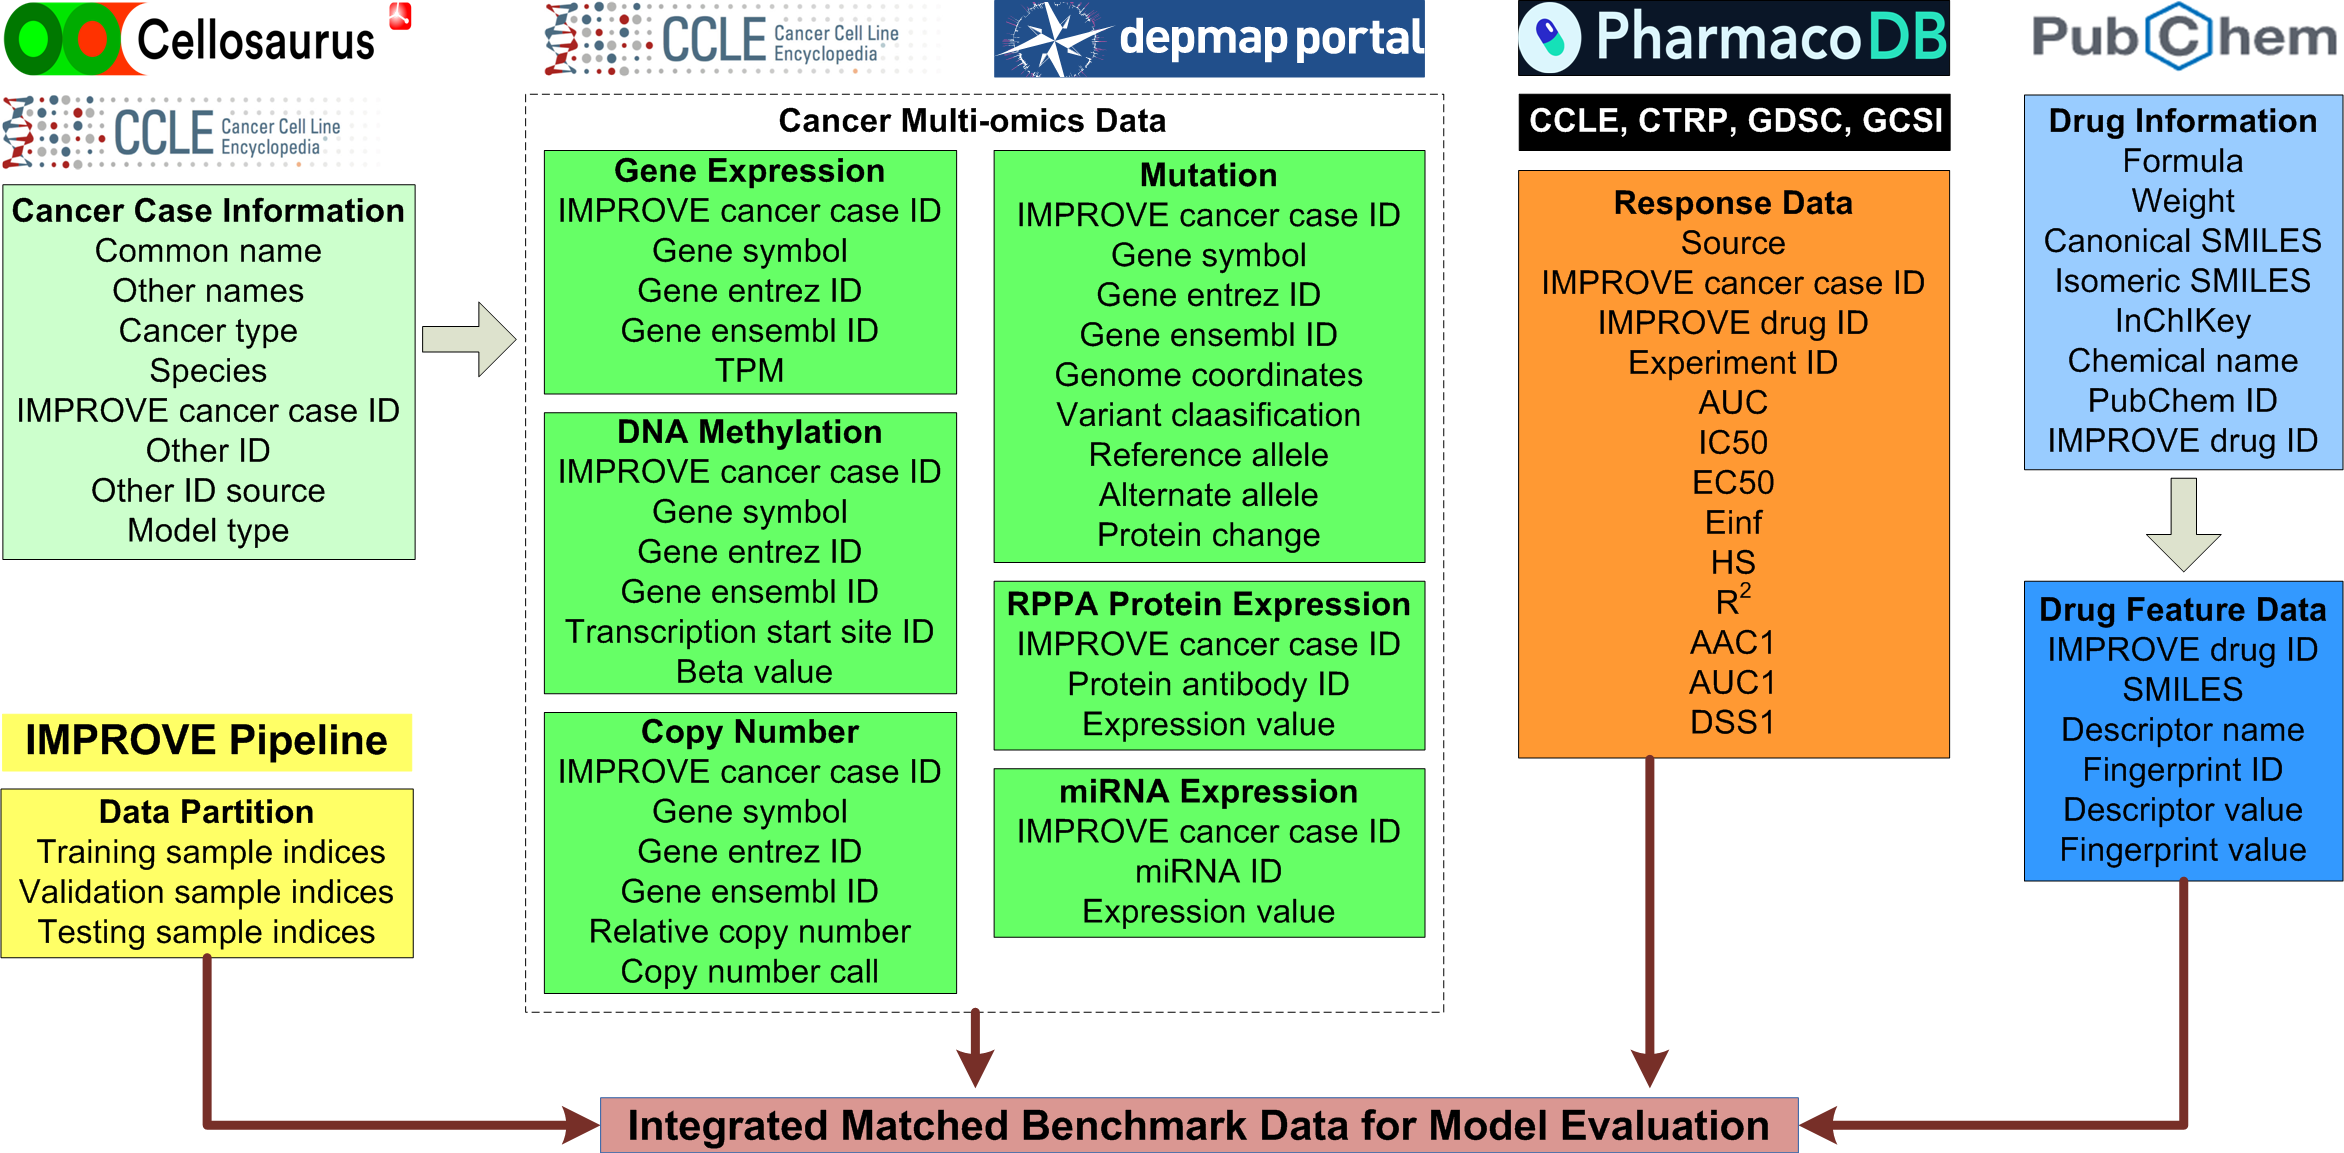
Flowchart illustrating the curation, processing, and assembly of benchmark data for the CSA model evaluation. Each block indicates one type of data with the data type name shown in the bold font followed by attribute names in the data table. These define a unified data schema that is applied across all five drug screening datasets.
Dataset |
Number of cell lines |
Number of drugs |
Number of experiments |
|---|---|---|---|
CCLE |
411 |
24 |
9519 |
CTRPv2 |
720 |
494 |
286665 |
GDSCv1 |
546 |
294 |
171940 |
GDSCv2 |
470 |
168 |
114644 |
GCSI |
312 |
16 |
4941 |
Data Location
Data File Description
- “y_data” folder includes drug response data
response.tsv: multiple dose-independent response metrics.
- “splits” folder includes sample indices corresponding to rows in “response.tsv” in “y_data” folder. Sample index starts with 0. Take CCLE as an example to explain sample index files.
CCLE_all.txt: indices of all samples in CCLE dataset.
CCLE_split_0_test.txt: indices of testing samples in split 0 of CCLE dataset.
CCLE_split_0_train.txt: indices of training samples in split 0 of CCLE dataset.
CCLE_split_0_val.txt: indices of validation samples in split 0 of CCLE dataset.
- “x_data” folder includes multi-omics data of cancer cell lines and multi-modal data of drugs.
cancer_DNA_methylation.tsv: average DNA methylation values in transcription start sites.
cancer_RPPA.tsv: protein expressions measured using RPPA.
cancer_copy_number.tsv: continuous gene copy numbers.
cancer_discretized_copy_number.tsv: discretized gene copy numbers. -2, -1, 0, 1, 2 indicate deep deletion, heterozygous deletion, neutral, copy number gain, copy number amplification, respectively.
cancer_gene_expression.tsv: log2 transformed TPM (transcripts per million reads mapped) gene expression values.
cancer_miRNA_expression.tsv: miRNA expression values.
cancer_mutation.parquet: binary matrix indicating mutation occurrences. Columns are cell lines. Rows are mutations.
cancer_mutation_count.tsv: gene-level mutation counts in cell lines.
cancer_mutation_long_format.tsv: each row indicates the occurrence of a mutation in a cell line.
drug_SMILES.tsv: SMILES strings of drugs.
drug_ecfp4_nbits512.tsv: ecfp4 binary fingerprints of drugs.
drug_info.tsv: meta information of drugs.
drug_mordred.tsv: Mordred descriptors of drugs.